


basetable is a fast in-memory data-manipulation package
for R with a base-R interface and no
dependencies. You write subset(),
transform(), aggregate(),
merge(), split(), and the work runs on the
package’s own C++ engine. There is no data.table, no
dplyr, no Arrow underneath, and nothing in
Imports beyond the base and recommended packages
(parallel, stats, utils).
Every verb returns a basetable: an ordinary
data.frame with one extra class so it prints compactly and
[ keeps the class. as.data.frame() strips it
back to a plain frame.
This is a deliberately focused tool. It is aimed at
[i, j, by], andsubset() /
merge() / aggregate() that want a faster
engine without a rewrite.subset(), transform(),
aggregate(), merge(),
split().subset() predicate evaluation run in compiled
.Call kernels. There is no third-party compute
backend.subset() and transform() inherit from base
R).data.table and
dplyr appear only in Suggests, and only as
competitors in the benchmark vignette.Install the released version from CRAN:
install.packages("basetable")Install the development version from GitHub:
# install.packages("pak")
pak::pak("ielbadisy/basetable")library(basetable)
# nested
describe(
transform(
subset(mtcars, cyl == 6, select = c("mpg", "hp", "wt", "cyl")),
power = hp / wt
)
)
# pipe
mtcars |>
pick(c("mpg", "hp", "wt", "cyl")) |>
transform(power = hp / wt) |>
aggregate(by = "cyl", value = c("mpg", "power"), fun = mean)
# table-1 style summary
summarytab(
transform(mtcars, am = factor(am, labels = c("Automatic", "Manual"))),
vars = c("mpg", "hp"), by = "am", p_value = TRUE
)Timing and memory below come from the bench package at
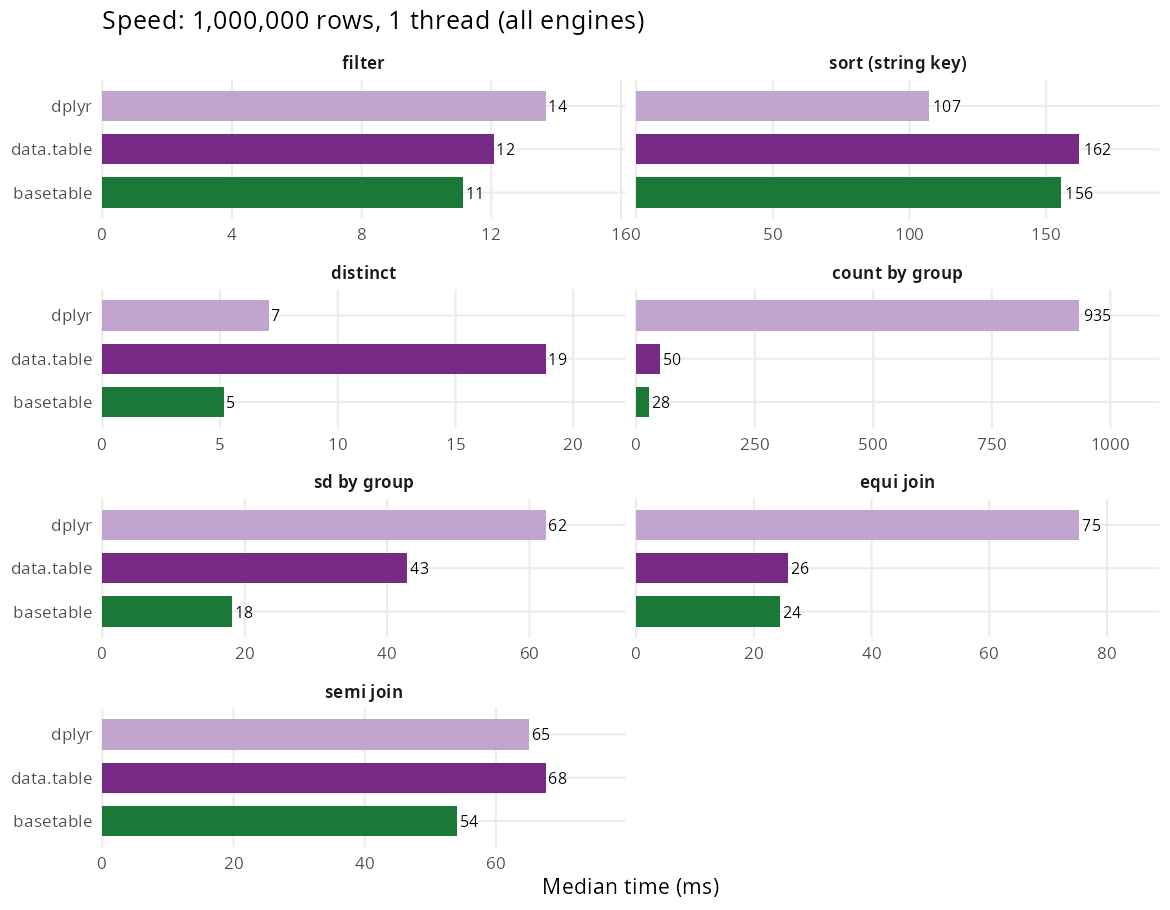
1,000,000 rows on one Linux machine
(inst/benchmarks/make-readme-figures.R regenerates the
figures; the Benchmarks vignette has the full reproducible
report). basetable is compared with
data.table, dplyr and collapse.
The table uses all cores, with basetable,
data.table and collapse given the same thread
budget (dplyr has no parallel path); the figures below are
the single-thread pass. Timings vary a few milliseconds from run to run,
so read differences of that size as ties.
| Operation | basetable | data.table | dplyr | collapse | basetable mem | data.table mem | dplyr mem | collapse mem |
|---|---|---|---|---|---|---|---|---|
| filter | 2 ms | 15 ms | 12 ms | 5 ms | 15 MB | 21 MB | 28 MB | 19 MB |
| sort (string key) | 22 ms | 49 ms | 95 ms | 44 ms | 34 MB | 47 MB | 69 MB | 38 MB |
| distinct | 1 ms | 7 ms | 6 ms | 3 ms | 0.03 MB | 20 MB | 12 MB | 3.9 MB |
| count by group | 5 ms | 53 ms | 678 ms | 8 ms | 1 MB | 30 MB | 30 MB | 5.5 MB |
| sd by group | 7 ms | 41 ms | 41 ms | 11 ms | 0.05 MB | 27 MB | 36 MB | 4.3 MB |
| equi join | 2 ms | 4 ms | 50 ms | 5 ms | 8 MB | 8 MB | 101 MB | 12 MB |
| semi join | 2 ms | 47 ms | 43 ms | 4 ms | 4 MB | 58 MB | 82 MB | 3.8 MB |
(equi join pins data.table to
sort = FALSE, matching basetable::merge(),
which returns rows in input order.)
basetable is the fastest engine on every operation here
when all cores are used. It is faster than collapse on all
seven (see basetable against
collapse below), faster than data.table on all seven,
and faster than dplyr on all seven, by more than 100x on
high-cardinality count.
With everything pinned to one thread (the figure above),
basetable still leads on six of the seven. The exception is
equi join, where data.table is level or
slightly ahead (2 ms against 3 ms).
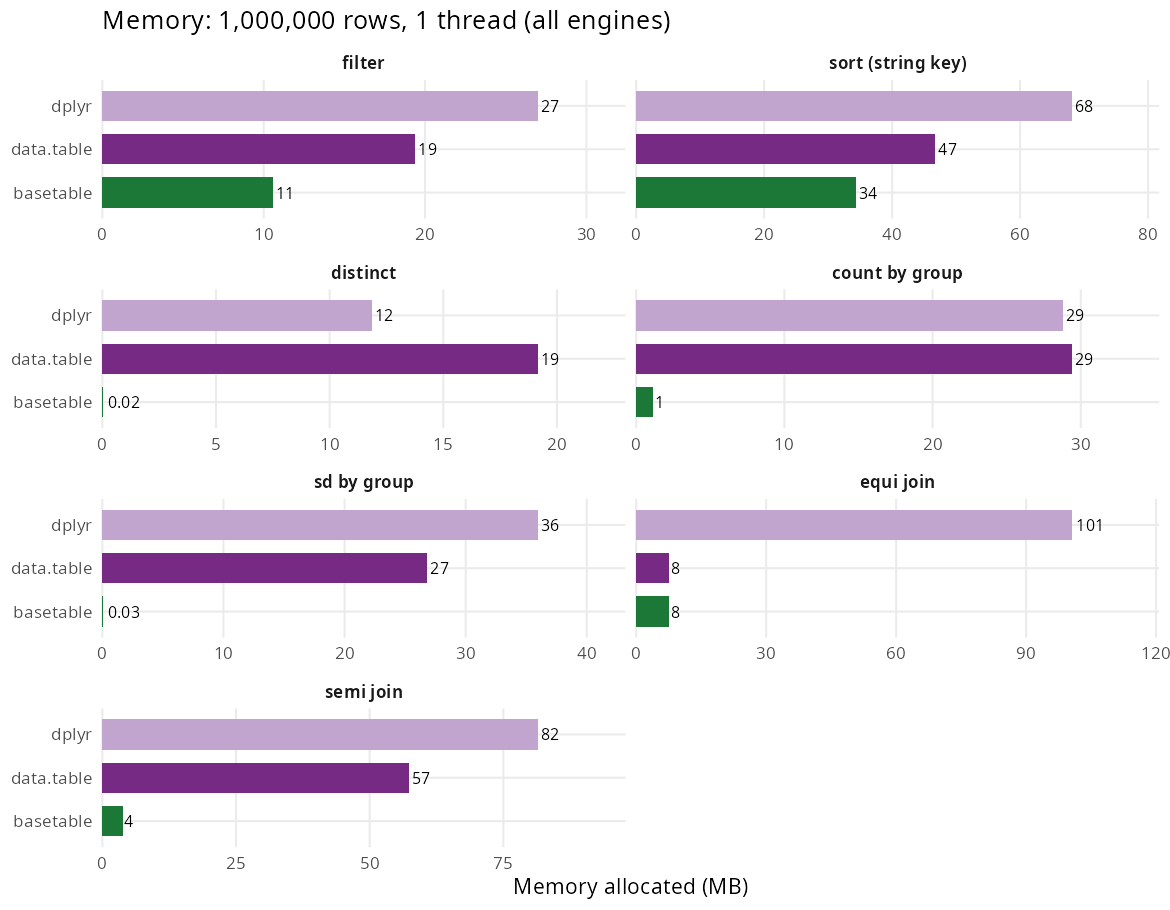
basetable allocates the least (or tied least) on every
operation measured. The size of the edge splits in two: overwhelming on
grouped reductions, where the result is tiny and nothing intermediate is
materialised in R; modest on operations that return a full table, where
the output frame itself sets a floor.
| Operation | basetable | data.table | dplyr | collapse | basetable vs data.table |
|---|---|---|---|---|---|
| distinct | 0.03 MB | 20 MB | 12 MB | 3.9 MB | ~650x less |
| sd by group | 0.05 MB | 27 MB | 36 MB | 4.3 MB | ~500x less |
| count by group | 1 MB | 30 MB | 30 MB | 5.5 MB | ~30x less |
| semi join | 4 MB | 58 MB | 82 MB | 3.8 MB | ~15x less |
| filter | 15 MB | 21 MB | 28 MB | 19 MB | ~1.5x less |
| sort (string key) | 34 MB | 47 MB | 69 MB | 38 MB | ~1.4x less |
| equi join | 8 MB | 8 MB | 101 MB | 12 MB | ~parity |
These are R-level allocations as reported by bench. The
C++ engine also uses malloc’d scratch buffers (radix keys,
per-thread row-position vectors) that bench does not count,
so peak process memory during a sort or filter is higher than the figure
above; data.table does the same, and collapse
allocates in C as well.
collapse was the fastest engine on most of these
operations in earlier releases, so it is the reference
basetable is now tuned against.
inst/benchmarks/profile-core.R runs the exact README
expressions for the two engines only, checks that both return the same
values, and times them in three alternating batches so neither engine
always runs first. Times are the median across batches; the speedup is
collapse time over basetable time.
| Operation | basetable, 1 thread | collapse, 1 thread | speedup | basetable, 16 threads | collapse, 16 threads | speedup |
|---|---|---|---|---|---|---|
| filter | 2.9 ms | 5.8 ms | 2.0x | 2.4 ms | 5.2 ms | 2.2x |
| sort (string key) | 42.4 ms | 47.4 ms | 1.1x | 23.6 ms | 47.4 ms | 2.0x |
| distinct | 1.4 ms | 3.0 ms | 2.1x | 1.4 ms | 3.1 ms | 2.1x |
| count by group | 5.4 ms | 6.9 ms | 1.3x | 5.4 ms | 7.0 ms | 1.3x |
| sd by group | 5.3 ms | 12.4 ms | 2.4x | 6.6 ms | 12.7 ms | 1.9x |
| equi join | 2.4 ms | 5.1 ms | 2.1x | 1.8 ms | 5.1 ms | 2.9x |
| semi join | 3.0 ms | 5.8 ms | 1.9x | 3.1 ms | 5.9 ms | 1.9x |
basetable is faster on all seven operations at both
thread counts, and in every case its slowest batch still beats the
fastest collapse batch. The narrowest margin is
single-thread string sort, at about 10%. To reproduce:
BT_FIG_REPS=25 Rscript inst/benchmarks/profile-core.RSetting BT_PROFILE=1 also prints the time spent in each
native phase (lookup, scatter, gather, and so on) for every
operation.
nest() collapses each group into a data frame held in a
list-column, and unnest() expands it back. They are
compared here with tidyr::nest() and
dplyr::group_nest() for nesting, and
tidyr::unnest() for unnesting, at 1,000,000 rows and four
columns (integer key, double, integer, character), varying the number of
groups. Medians and R-level allocations come from bench;
inst/benchmarks/benchmark-nest.R reproduces them.
| Operation | Groups | basetable | tidyr | dplyr | basetable mem | tidyr mem | dplyr mem |
|---|---|---|---|---|---|---|---|
| nest | 10 | 13 ms | 19 ms | 18 ms | 23 MB | 39 MB | 27 MB |
| nest | 1e3 | 20 ms | 30 ms | 48 ms | 23 MB | 39 MB | 27 MB |
| nest | 1e5 | 127 ms | 169 ms | 1.42 s | 6 MB | 24 MB | 20 MB |
| unnest | 10 | 13 ms | 16 ms | 16 ms | 27 MB | 31 MB | 31 MB |
| unnest | 1e3 | 13 ms | 21 ms | 21 ms | 27 MB | 31 MB | 31 MB |
| unnest | 1e5 | 48 ms | 425 ms | 388 ms | 29 MB | 34 MB | 34 MB |
basetable is faster than both packages on every row. The
edge is modest for nest() (about 1.3x to 1.5x over
tidyr) and grows with the number of groups for
unnest(), where it is roughly 9x faster at 1e5 groups
because the nested frames are stacked in one native pass. As elsewhere,
the C++ engine also uses malloc’d scratch buffers that
bench does not count.
basetable now leads the engines measured above on speed,
but data.table and collapse cover far more
operations and data.table has a far larger ecosystem;
dplyr is the tidyverse standard. basetable is
a good fit when you want:
[i, j, by], tidy evaluation, or a method-chained frame
object;Grouping is a by argument on the verb that needs it
(aggregate(), count(),
summaries(), transform(),
subset(), samplerows(),
firstby(), …), not a stateful group_by(). The
group is named at the call and never persists, so there is no
ungroup() to forget.
basetable reuses base-R verb names
(subset(), merge(), transform(),
split(), aggregate()) on purpose. It does
not ship the dplyr-coined verbs (filter(),
select(), mutate(), arrange(),
summarise(), distinct(),
glimpse(), …), so it can be attached next to
dplyr without shadowing its grammar. The two names it
shares with dplyr are count() and
pick(), kept because they read as base-style verbs; with
both packages attached, whichever was attached last
wins for those (and for the base-R names data.table also
defines). Two fixes:
basetable::transform(...);conflicted::conflict_prefer("transform", "basetable") once
per session.| Family | Exported functions | Base reference |
|---|---|---|
| Row subsetting | subset() |
base::subset() |
| Column keep / drop / rename | pick(), drop(),
renamecols() |
[, names<-() |
| Transformation | transform(), within() |
base equivalents |
| Ordering | orderrows() |
order() |
| Distinct / duplicates | uniquerows(), duplicaterows(),
removeduplicates() |
unique(), duplicated() |
| Aggregation | aggregate(), count(),
summaries() |
aggregate(), table() |
| Recoding | recode(), collapsevalues(),
casewhen(), replacewhere() |
ifelse(), switch() |
| Joins | merge(), semimerge(),
antimerge(), updatemerge(),
crossmerge(), nonequimerge(),
overlapmerge(), rangemerge(),
rollingmerge() |
merge() |
| Row / column bind | rbindfill() |
rbind() |
| Split / apply | split(), applyby() |
split() |
| Reshaping | tolong(), towide(),
reshape(), stack(),
unstack() |
base equivalents |
| Completion | completegrid() |
expand.grid() + join |
| File I/O | btread(), btwrite();
aggregate() / count() /
uniquerows() / freq() also take a file
path |
read.delim(), fused file to result |
| Inspection | preview(), dims(), types(),
headtail() |
str(), dim(), head() |
| EDA | describe(), missingness(),
profile(), freq(), summarytab(),
compare() |
base summaries |
btread() memory-maps the file and, with
lazy = TRUE, returns columns as ALTREP vectors parsed on
first access. aggregate(), count(),
uniquerows() and freq() accept a single file
path as their first argument and fuse the parse with the grouping, so
unused columns are never materialised.
Every exported function has direct test coverage. Vignettes cover getting started, data manipulation, exploration, a complete function reference, and benchmarks. CI checks release R on Linux, macOS and Windows plus oldrel and devel.
The interface is inspired by base R; it is not a drop-in replacement
for every base function. In particular, aggregate() accepts
column names in by and value, rather than the
by list or formula interface of
stats::aggregate(). merge() defaults to
sort = FALSE (base R defaults to TRUE) and
requires at least one join column. Results carry the
basetable class; use as.data.frame() when a
plain data frame is required. Consult each function’s help for its
arguments and supported behavior.
Before joining, joinrelationship(x, y, by) reports
whether keys are unique on each side. It checks the entire input,
including keys that do not match; repeated missing keys count as
duplicates. matchedkeys(x, y, by) and
unmatchedkeys(x, y, by) return rows of x with
keys present or absent in y, respectively, preserving
duplicate rows from x. These tools help expose unexpected
multiplicity and missing matches before a join.