ggpsychro

‘ggplot2’ extension for making psychrometric charts.
Features
- ggplot2-native psychrometric charts with SI/IP units and Mollier
orientation.
- Preset grid and style helpers for common psychrometric chart
layouts.
- ASHRAE-style psychrometric protractor for sensible heat ratio and
heat-moisture-ratio guides in the chart mask area.
- Psychrometric stats for relative humidity, wet-bulb temperature,
vapor pressure, specific volume, enthalpy, and humidity ratio.
- State points, process lines, and filled operating zones for HVAC
workflows.
- Thermal comfort and bioclimatic overlays for PMV/PPD, SET, adaptive
comfort, labelled contours, Heat Index, PMV-based ASHRAE 55 / EN 15251
zones, and Givoni-Milne strategy zones.
Installation
You can install the released version of ggpsychro from CRAN with:
install.packages("ggpsychro")
You can install the development version from GitHub with:
# install.packages("remotes")
remotes::install_github("hongyuanjia/ggpsychro")
Example
The creation of a psychrometric chart starts with
ggpsychro(). The result is a ggplot object, so grids,
stats, geoms, scales, and themes can be added with the same
+ workflow used by ggplot2.
ggpsychro(tdb_lim = c(0, 50), hum_lim = c(0, 30)) +
    psychro_preset("minimal")

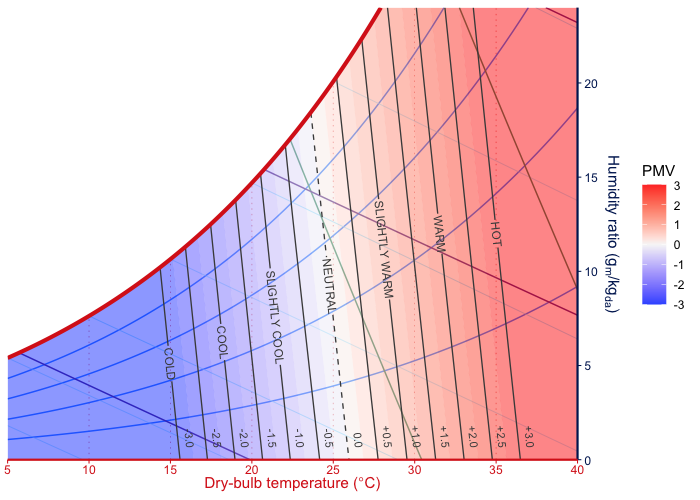
Comfort overlays can be added as regular layers. The PMV overlay
combines root-traced filled bands, PMV isolines, and text labels on the
same psychrometric chart.
ggpsychro(tdb_lim = c(5, 40), hum_lim = c(0, 24)) +
    psychro_preset("minimal") +
    geom_comfort_pmv(
        contour_levels = seq(-3, 3, by = 0.5),
        n = c(70, 48)
    ) +
    scale_fill_comfort_pmv(name = "PMV")
Learn more
The longer examples live on the pkgdown site:
- Get
started - build basic charts, choose limits and units, use Mollier
orientation, and add ggplot layers.
- Chart
grids and styles - tune dry-bulb, humidity-ratio, relative-humidity,
wet-bulb, enthalpy, and specific-volume grid guides, plus the
psychrometric protractor.
- Plotting
psychrometric data - plot points, bins, and overlays from weather or
measured state data.
- Comfort
overlays - draw PMV, SET, adaptive comfort, labelled comfort
contours, Heat Index, PMV-based standard zones, and Givoni-Milne
strategy overlays.
- Zones
and processes - draw manual comfort regions, operating limits, state
points, and HVAC process lines.
Acknowledgements
ggpsychro’s recent chart-layout and higher-level layer work was
informed by two excellent psychrometric chart projects:
- psychrochart,
especially its preset-oriented chart configuration, labelled reference
grids, zone support, and export-focused chart composition.
- Andrew Marsh’s Psychrometric
Chart, especially its interactive psychrometric workflows,
weather/data overlays, comfort display ideas, and import/export-oriented
chart interactions.
ggpsychro does not vendor code from those projects. The
implementation remains R/ggplot2-native, with psychrometric property
calculations delegated to PsychroLib where
appropriate.
Author
Hongyuan Jia
License
The project is released under the terms of MIT License.
Copyright © 2019-2026 Hongyuan Jia
Contribute
Please note that the ‘ggpsychro’ project is released with a Contributor
Code of Conduct. By contributing to this project, you agree to abide
by its terms.