
Segmentation and object detection for medical images, from a folder of pictures to a figure.


This is a rewrite, and an alpha. The package released in 2020 was built on TensorFlow through the R keras package. This one runs on PyTorch through pyplatypus, which it installs and isolates for you. The API is different and will still move. The old version is on the
masterbranch.
R has excellent tools for reading medical images and a healthy deep learning stack, and almost nothing joining them: re-counted on 2026-11-05, the CRAN Task View for Medical Image Analysis lists 49 packages and not one of them is a neural network. This is an attempt at the missing piece — not a wrapper around a Python library you then have to learn, but an R package that happens to compute in Python.
install.packages("rplatypus")# or the branch where work lands between submissions
# install.packages("remotes")
remotes::install_github("maju116/rplatypus@new-release")There are three states here rather than two, and the middle
one is easy to miss. CRAN carries the version that was
submitted and accepted. The default branch is the submission
candidate - what has been sent, or is about to be - so
install_github("maju116/rplatypus") serves that rather than
the newest work. new-release is where the work lands, which
means a fix made after a submission is frozen lives there and nowhere
else until the next one goes out, and the policy asks for no more than
one every one to two months. Take CRAN unless you are waiting on
something specific, and @new-release when that something
was fixed after the last submission left.
There is nothing to set up afterwards. The first call that needs the engine builds an isolated Python environment for it, and everything after that uses the cache. You never choose an interpreter, activate anything, or match a version.
Three things are worth knowing before that first call, and
all three are about PyTorch rather than about this package. It
downloads about 5 GB, because the wheel carries CUDA whether or not
there is a GPU - cached afterwards, and portable to a machine with no
connection. On a GeForce GTX 10-series card or older, call
platypus_use_torch("pascal") first: current builds
target CUDA 13, which dropped that generation, so without it everything
trains on the processor - perhaps ten times slower, with nothing
obviously wrong. platypus_device() says which one you got.
And on macOS this needs Apple Silicon: torch has
published no macOS x86_64 wheel since 2.2.2, so on an Intel Mac the
engine cannot be built at all, and the first call is where you find that
out. About the engine, below, has all three in full.
The package was called platypus until
2026-10-14 and is rplatypus now - one name per
language, beside the pyplatypus engine on PyPI. The
repository moved with it, so github.com/maju116/platypus
redirects here and every link anybody already has still works. What you
type changed: library(rplatypus). The functions did not -
they are still platypus_spec(), platypus_fit()
and the rest, because the family is the brand and the package name is
only what CRAN and library() see.
Coming from platypus 0.1.1? Code written against the 2020 release will not run on this one, and the changelog says what moved, what is gone, and which three names are still exported and mean something else. It is seventy lines and most readers need none of them, which is why it is there rather than here.
library(rplatypus)

spec <- platypus_spec(
  data = segmentation_data(
    train      = "stage1_train",
    validation = "stage1_validation",
    colormap   = binary_colormap
  ),
  models = list(
    u_net("unet", input_shape = c(160, 160),
          loss    = loss_cce_dice(),
          metrics = list(metric_dice(include_background = FALSE)),
          epochs  = 12),
    linknet("linknet", input_shape = c(160, 160),
            loss    = loss_focal_tversky(alpha = 0.7),
            metrics = list(metric_dice(include_background = FALSE)),
            epochs  = 12)
  )
)

fit <- platypus_fit(spec)
evaluate(fit)
#>     model architecture loss_function parameters epochs_run  loss  dice   iou
#> 1    unet        u_net      cce_dice    1942594         12 0.096 0.878 0.797
#> 2 linknet      linknet focal_tversky    1746754         12 0.071 0.881 0.797
Read that loss column with care, which is why
loss_function sits beside it: two models trained on
different objectives are not on a common scale. The metrics are
comparable, because they measure the mask rather than the objective.
Then look at what it did, which is the part a score cannot do for you:
plot_masks(images, prediction = predict(fit, "unet"), truth = truth,
           colormap = binary_colormap)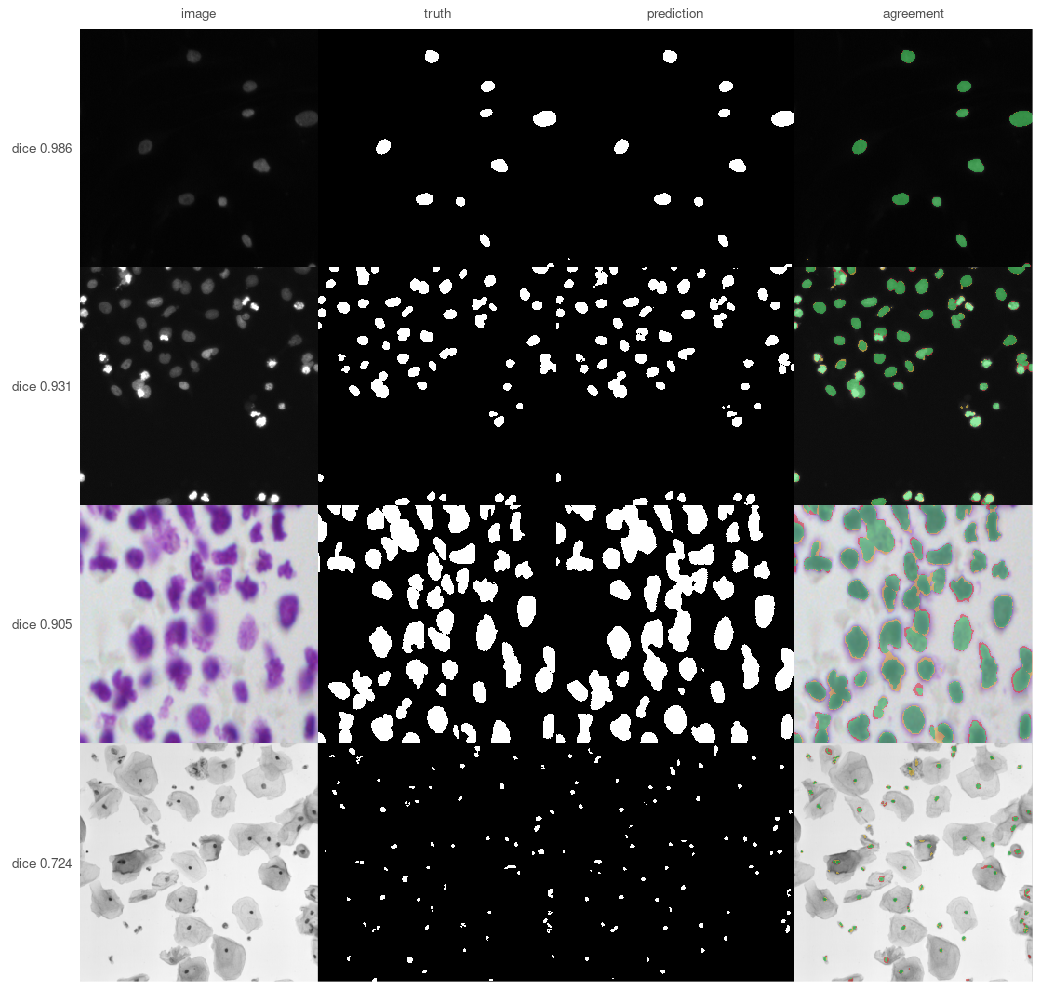
Four of the 134 images the published dsbowl-unet weights
were held out from: the best, two from the middle of the ranking and the
worst, so the picture covers the distribution the model card reports
rather than its top. Green is what was found, red what was missed,
yellow what was invented.
In the third row nearly all of the red is a thin rim around nuclei that were otherwise located correctly — the model draws them slightly too small. If the question is how many nuclei, that hardly matters; if it is how large, it is the whole answer. No single overlap score tells those apart. The bottom row is the card’s worst case at 0.724, and it shows what that number is rather than asserting it: tiny dark nuclei in a brightfield image, where the model finds specks.
Drawn by tools/readme_figures.R, which remakes the
seeded split those weights were measured on and refuses to draw unless
it reproduces the card’s own mean of 0.9205 and worst case of 0.7240.
The full walk-through is in
vignette("data-science-bowl").
spec <- platypus_spec("experiment.yaml")Arguments and YAML produce the same object, and nothing downstream can tell which was used — so a configuration file and an R script describe the same experiment, and either can be handed to a colleague.
Four architectures — U-Net, U-Net++, Res-U-Net and LinkNet — composable with separable convolutions, spatial dropout, interpolated or learned upsampling, deep supervision and block width.
Eleven losses for segmentation (IoU, Dice,
cross-entropy, CCE-Dice, Focal, Tversky, Focal-Tversky, Combo, Lovász,
Boundary and generalized Dice) and five metrics (Dice,
IoU, Tversky, clDice and surface Dice), each of which can leave the
background out. In medical images the background is usually most of the
picture, and averaging it in turns a model that found nothing into one
that looks respectable. available_losses() and
available_metrics() take a task, and instance work has
fourteen losses rather than eleven.
One label for a whole image.
classification_data() and classifier() are the
fourth task, since the engine’s 0.8.0a49: the label is the
directory an image sits in, or a column in a CSV. There is no
architecture to choose - the network is a contracting path with a dense
layer on top, and encoder decides whose path it is - and
the default metric is metric_auc() rather than accuracy,
because a classifier that answers “no finding” where 3% have one scores
0.97 and has learnt nothing. class_balance() says what the
labels look like before you train on them, and the split is stratified,
because a random 70/15/15 of 100 images at 3% prevalence leaves some
part with none of the rare class 91% of the time.
A label that is a set, for one image with several
findings at once. labels_from names one CSV column per
class, in class order, and it is a third labelling rather than a switch:
the target changes and not only the activation, so there is nothing a
multilabel = TRUE could have meant on a label
column that structurally cannot say an image has two findings.
metric_accuracy() is refused there outright - on 4000
images with findings at 10%, 5%, 3% and 2%, a model answering no to
everything scores 0.8137 on exact match, above a model holding half the
signal.
Tiling that goes both ways — cut a large image into a grid instead of shrinking it, and get a full-size mask back.
One channel per file.
channels_from = c("_t1\\.nii", "_t1ce\\.nii", "_t2\\.nii", "_flair\\.nii")
stacks four MRI sequences per patient in the order you name, which is
how BraTS ships and how satellite bands arrive. The order is stated
rather than inferred: sorted, those names come out flair, t1, t1ce, t2 —
reproducible and anatomically meaningless, and a model trained with
FLAIR in channel one answers plausibly on data where channel one is
T1.
The mask comes back on the scan’s grid.
predict(fit, space = "source") maps each prediction out of
the model’s grid onto the one its scan arrived on, undoing the
resampling and the crop, so save_volumes() can write a mask
that opens on top of that scan in any viewer. It returns a list rather
than an array, because scans differ in size and resizing them to match
is how a mask ends up describing the wrong anatomy.
Volumes. NIfTI or a folder of DICOM slices in, 3D
U-Net out, patches through the same tiling.
target_spacing = c(1, 1, 1) resamples every scan to a
common voxel size and then crops or pads to the model’s shape, rather
than squeezing each one into the same box — forty slices of 1 mm is 40
mm of patient and forty of 2.5 mm is 100 mm, so resizing alone leaves
the same organ a different size in each. series_report()
checks a whole export before anything trains — reading no pixels, one
row per folder — and says which series have a missing slice, duplicated
files, or two series sitting in one directory. A gap matters more than
it sounds: it does not shorten a volume, it moves everything past it,
and no metric would show that. Masks are label maps
(labels = c(0, 1)) rather than colours, because that is how
volume formats store them. save_volumes() writes
predictions as NIfTI carrying the geometry of the scan they came from —
a mask without that affine cannot be laid over its scan by any viewer —
and mask_volume() reports a segmented structure in
millilitres, which is the number that goes in a report, not a voxel
count that means nothing outside one scanner.
Splitting by patient, not by slice.
split_dataset() divides one directory into training,
validation and test sets and keeps every group whole; the result goes
straight into segmentation_data(). This is the most common
way a segmentation result comes out several points too good: a scan is
many slices of one patient, so splitting at random puts the same anatomy
on both sides and validation ends up measuring memory. A
group_by pattern that matches nothing is an error, never a
quiet fallback.
A score per case, not one per dataset.
evaluate_cases() reports each image — or each patient — and
summary() gives the distribution and names the worst one.
On the Data Science Bowl a model averaging Dice 0.855 turned out to
score 0.006 on three images. The mean had no way of saying so.
Augmentation in 3D, with
available_transforms(rank = 3) to say what can be used on a
volume — albumentations supports them unevenly, and a transform that
cannot is refused by name when the run starts rather than raising
KeyError: 'images' from inside the library an hour in.
The parts that make an analysis fast, which is what the package was always for: combining the per-object mask files that datasets like the Data Science Bowl ship, converting between class indices and colours, overlaying, and drawing the comparison above. These work on ordinary R arrays and need no Python at all.
Published weights, by name.
weights = "dsbowl-unet" in an architecture loads a trained
model instead of training one — available_weights() lists
what is published and what each one can and cannot do. A name is pinned
to one commit of the repository holding it, so it means the same numbers
next year. export_weights() writes your own the same way,
with a sidecar recording what they were trained on, which is what makes
them usable by anybody else.
A refusal before a wasted day. A colormap or set of
labels that matches none of your masks is the quietest failure in
segmentation: every mask reads as background, the loss falls because
background is most of a medical image, the metrics look respectable for
the same reason, and the model learns to answer “nothing here”.
platypus_fit() reads a sample of the training masks first
and refuses when a class the specification declares appears in
none of them — which is provable rather than suspicious,
because a class with no examples has no gradient towards it.
inspect_masks(spec) asks the same question over as much of
the data as you like, and check_masks = FALSE proceeds
regardless.
A backbone where one helps.
encoder = "resnet34" swaps the contracting path for a timm
architecture and pretrained = TRUE loads its ImageNet
weights, with freeze_encoder to keep them from being
undone. Whether that is worth doing is a measured question rather than a
rhetorical one — see below, and ?encoders for the
table.
task is never typed. detection_data() and
yolo3() carry it, and a specification that mixes a
detection data block with a segmentation model is refused by name.
cells <- c("RBC", "WBC", "Platelets")

spec <- platypus_spec(
  data = detection_data("train.csv", "valid.csv", classes = cells, mode = "config_file"),
  models = list(yolo3("cells", input_shape = c(416, 416), epochs = 150,
                      augmentation = list(augmentation_step("HorizontalFlip", p = 0.5)),
                      callbacks = list(callback_cosine_annealing())))
)

fit   <- platypus_fit(spec)
found <- predict(fit, split = "test")     # one data frame per image, in its own pixels
plot_boxes(read_images(files, size = NULL), found, min_score = 0.5)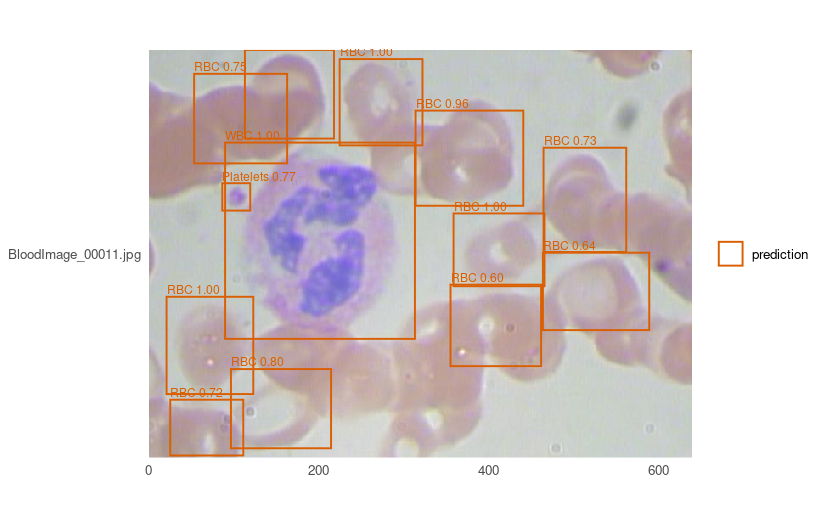
One frame of BCCD’s held-out split, drawn by bccd-yolo3
— weights published with this package, so the picture above costs a
download rather than an afternoon. Both rare classes are there: the
white cell at 1.00 and the platelet at 0.77. Of the 17 red cells
annotated in this frame, 11 clear a score of 0.5 — the honest shape of
the result rather than a flattering crop. min_score is
yours to move, and evaluate_classes() is where that
trade-off stops being a judgement about one picture: the per-class rows
are what say which class a threshold is costing you.
classes is in class order and is written down rather
than read from the files, because position is the class
index the model learns: sorted, BCCD’s three come out
Platelets, RBC, WBC, which is reproducible and anatomically
meaningless.
Five things differ from the segmentation path and each is a decision rather than an omission:
Anchors are fitted to your boxes unless you name
them. Measured on BCCD’s 2,805 training boxes, COCO’s nine borrowed for
blood cells cover them at a mean overlap of 0.65 against 0.88 for fitted
ones, which is the difference between a correction and a rewrite. They
come back from detection_anchors(), and they travel with
exported weights — a detector cannot be reloaded without
them, because read with other anchors the same weights decode
every box scaled by a fixed factor, plausibly and in the wrong
places.
No loss and no metrics on the
model. YOLOv3’s objective is part of its architecture and mean
average precision is not one option among several.
plot_anchors() shows the fit rather than scoring
it. Every annotated box as a point - width against height, both
fractions of the model’s input - coloured by class, with the anchors on
top. It answers what a mean overlap cannot: a coverage of 0.65 is either
“every class covered adequately” or “two covered well and the third not
at all”, and those want different fixes. Draw it for a split the anchors
were not fitted on and a gap between the halves of your data
becomes visible, which no training curve shows.
A run can leave a record. Give
output_dir and platypus_fit() writes the
specification, the history, and anything the run worked out that the
specification does not already say - a detector’s fitted anchors, which
it cannot be reloaded without. Unset, which is the default, writes
nothing: files appearing in your working directory because a default
exists is not a thing this package does.
No overall precision or recall in
evaluate(). Averaging them over classes needs a weighting
and every weighting is a different claim: over BCCD’s 4,155 red cells,
372 white and 361 platelets, a single precision is a statement about red
cells. evaluate_classes() gives the per-class rows, which
is the form in which they mean something, and
evaluate_images() gives one row per picture — not how well
on average, but which frames it fails on. Order those by
missed for the ones it cannot see and by
mean_matched_iou for the ones it sees and places badly;
they are usually different problems. There is deliberately no average
precision per image: it is the area under a ranking’s curve, and one
picture is not a ranking.
A published detector to start from, so boxes on an image need no GPU:
borrowed <- platypus_fit(platypus_spec(
  data = detection_data("images.csv", "images.csv", classes = cells, mode = "config_file"),
  models = list(yolo3("cells", input_shape = c(416, 416),
                      weights = "bccd-yolo3", fit = FALSE))
))
bccd-yolo3 scores mAP@0.5 0.857 on BCCD’s own held-out
split — the median of five seeds, not the best, because
the spread across them is 0.016 and a single number would be whichever
seed got reported. available_weights() lists what is
published and what it is for; the description is the part to read, and
for this one it says platelets are the unreliable class.
encoder = "resnet34" replaces the contracting path with
a timm backbone, and pretrained = TRUE is a separate flag
that loads its ImageNet weights — separate so that naming an
architecture never reaches the network on a machine that has none.
u_net("polyps", input_shape = c(256, 256),
      encoder = "resnet34", pretrained = TRUE, freeze_encoder = 5)
What it is worth was measured rather than assumed, on three datasets, one per modality, three seeds each, every configuration judged at its best validation Dice:
| DS Bowl, microscopy | SIIM-ACR, chest X-ray | Kvasir-SEG, endoscopy | |
|---|---|---|---|
| built-in encoder, 1.9M | 0.8460 | 0.0531 | 0.5830 |
encoder = "resnet34", 9.0M |
0.7891 | 0.1073 | 0.5670 |
the same, pretrained, freeze_encoder = 5 |
0.8333 | 0.1203 | 0.5932 |
the same, encoder_learning_rate = lr/10 |
0.8326 | 0.1011 | 0.5329 |
The short version, and ?encoders has the long one:
freeze_encoder, not
encoder_learning_rate alone. Freezing was better
on all three; on Kvasir a tenth of the rate is the worst row in
the table, below even the same backbone trained from nothing.Measure on your own images before trusting any of this. The regime where transfer helps is narrow, and three public datasets are three public datasets.
The vignettes are all precomputed from real runs — every number and figure in them came out of running the code shown.
Read them at maju116.github.io/rplatypus,
which also carries the reference for every function. Browsing them here
on GitHub does not work: GitHub has no renderer for .Rmd
and serves the source, figures and all, as plain text. From R,
vignette("blood-cells") opens the same document
locally.
vignette("data-science-bowl") is two-dimensional
microscopy: the 2018 Data Science Bowl, one mask per nucleus, from a
folder of images to a figure.
vignette("instances") is the same microscopy read a
different way: the per-nucleus masks kept as identities rather than
united, so the answer is a count instead of an area. It opens with
published weights decoded two ways — one forward pass giving 245 objects
or 180 on the same picture, which is sixty-five touching nuclei run
together — and ends on the measurement that closed this direction:
connected components caps any model here at 0.7655, so the headroom is
in the mask and not in the separation signal.
vignette("blood-cells") is detection: BCCD, boxes rather
than masks, opening with a published detector before any training. It
ends on the finding that made the measurement honest — across five seeds
the overlap of the matched boxes varies six times less than the average
precision does, so on a dataset that size a point of mAP is not a
result.
vignette("classification") is the fourth task and it
continues the detection page: it cuts that published detector’s boxes
out with detection_crops(), writes them to disk as one
directory per class, and trains a classifier on the pieces. It is the
only vignette here whose subject fails. The classifier learns the three
cell types nearly perfectly and cannot do the one thing it was added for
- reject the boxes that match no annotation - and the measurement says
why: those crops are red cells that BCCD does not annotate, so the label
is a statement about the annotation rather than about the picture, and
no model can read it off a picture of a cell.
vignette("volumes") is CT, and generates its own
synthetic data so it can be run without downloading anything: voxel
spacing, splitting by patient, resampling, per-patient scores, a slice
to look at, and the size of a finding in millilitres. It ends on
something worth knowing — a model at Dice 0.88 whose volumes were 12% to
23% too large, which is not a contradiction and is the reason to report
both.
vignette("fetal-head") is the only one that does not end
on a score. HC18 is 2D obstetric ultrasound with a sonographer’s ellipse
drawn round each fetal skull, and the answer it is built to give is a
head circumference in millimetres, because that is what
gets written down and charted. Nobody charts a Dice — and the page
measures why that matters: tens of the test images scoring 0.95 or
better are still wrong by more than 2 mm, and the two orderings rank the
same images differently every time it is run. No figure from that
comparison is quoted here, because it is the one number on that page
that moves between runs; the page carries four of them side by side and
says so.
What does not move is what the dataset costs before any model does.
HC18’s annotation is a drawn curve 2.52 pixels wide and the mask is that
curve filled, so every mask is half a line width too large:
pi * w * pixel predicts +1.11 mm against the +1.12 mm
measured, with 0.01 mm left unexplained. The split is seeded, so that
control reads the same on every run.
vignette("retinal-vessels") is the one that cannot
resize its images: FIVES fundus photographs at 2048 x 2048, where the
vessel to find is about nine pixels wide and a resize to 256 leaves it
at one — the width at which a displacement of a single pixel overlaps
the truth nowhere at all. So the images are tiled at full resolution,
and scored on clDice, which asks whether a structure is connected rather
than whether its pixels coincide. It reports per disease group, and ends
on a warning rather than a score: the group that looks hardest is the
group whose photographs are worst, and the dataset’s own quality grading
says so.
Ensembling. Boxes in three dimensions - yolo3() is 2D
and says so rather than accepting a third number and ignoring it.
Augmentation in 3D works, but unevenly, because albumentations
supports volumes for most of its transforms and not all of them. Every
transform in a 3D specification is probed while the pipeline is built,
so one that cannot take a volume is named at that point rather than
failing mid-run; available_transforms(rank = 3) lists what
is usable.
Resampling volumes to isotropic spacing is deliberate rather than
automatic: volume_info() reads and reports the spacing, and
target_spacing applies it, but applying it changes the
voxel grid the model sees, which is a decision to take rather than a
default to inherit.
The package is on CRAN: 0.2.1,
published 2026-11-04, after 0.2.0 was submitted on
2026-10-14 and sent back for two documentation points. Its page on CRAN is
the live answer rather than this sentence, which can only say what was
true when it was written - and the check page beside it is the one that
matters, since CRAN runs the checks daily on more platforms than any CI
matrix here. The name question that used to stand here is settled, and
the answer is the name at the top of this page: Platypus,
unrelated work in immunology, was archived from CRAN in February 2026,
archiving does not release a name, and this package was renamed rather
than asking for an exception.
pyplatypus is installed automatically into an
environment kept apart from any other Python on the machine. This
matters because the R keras and tensorflow packages of 2020 shared one
installation with everything else, and an unrelated change could break
an R session. Nothing here touches a Python anyone else uses.
Four things worth knowing.
The first call downloads about 5 GB, most of it CUDA
libraries that PyTorch ships by default whether or not there is a GPU.
It is cached afterwards, and everything works offline once it is — which
is the install path for a machine without internet access: run it once
somewhere with a connection and carry ~/.cache/uv
across.
On a GeForce GTX 10-series card or older, ask for the older PyTorch first:
library(rplatypus)
platypus_use_torch("pascal")
PyTorch 2.8 onwards ships CUDA 13 builds, and CUDA 13 dropped that
whole generation of cards. Without this, everything runs on the
processor instead — perhaps ten times slower, with nothing obviously
wrong. platypus_device() will tell you which is
happening.
On macOS this needs Apple Silicon. torch has published no macOS x86_64 wheel since 2.2.2, which was March 2024, and the engine asks for at least 2.7 - so on an Intel Mac there is no PyTorch it will accept and the environment cannot be built. Nothing goes wrong until it is needed: the package installs from CRAN like any other, loads, and the first call that wants the engine is where it stops. This is not something either package can work around, and the engine’s own README carries the measurement and why its floor stays where it is.
If the engine will not start and the error says there is no such version of pyplatypus, the version does exist and something is answering from a cached copy of the package index — likely because the engine was published minutes ago. Remove this one package’s index entry, from both of the places it can live:
rm -rf ~/.cache/uv/simple-v*/pypi/pyplatypus.rkyv \
       ~/.cache/R/reticulate/uv/cache/simple-v*/pypi/pyplatypus.rkyv
Two places, because there may be two caches, and this page
named only one until 2026-11-09. reticulate uses a
uv from your PATH if you have one and
otherwise installs and manages its own — which is the ordinary case for
the reader this page is written for, the one who never chooses an
interpreter. A managed uv keeps its cache under
~/.cache/R/reticulate/uv/cache, so
uv cache clean pyplatypus in a terminal either fails with
command not found or cleans a cache your failing install never
read. The command above needs no uv on your
PATH and touches one file per cache.
If you do have uv and want the shorter form,
uv cache clean pyplatypus is enough for that
uv’s cache — measured on six engine releases — and nothing
for the other one.
And neither command fixes the other cause. A freshly published version can be missing from the package index your machine happens to reach, with every cache empty; then there is nothing to clear and waiting a few minutes is the whole remedy. That is why a refusal is worth reading twice before anybody deletes anything.

Both halves of this are by Michał Maj — this R package, and the Python engine it calls.
The first version was a Keras and TensorFlow package in 2020, and it
is still on master with the stars and the open issues it
earned. Everything here was written from scratch in 2026 on torch, which
is why the version numbers restart rather than continue.
MIT.